Working With FEC Data in R
Note 08/31/2018: Since this post, I wrote an R package that makes it a lot simpler.
With historic midterms coming up, there’s growing interest in campaign financing. With help from 18F, the FEC has been rolling out a new website and openFEC, an API that makes working with this data programatically a relative breeze!
This tutorial walks you through:
- Signing up to use the FEC API
- Finding candidates in an election using the API
- Getting top financial summary data for them into R
- Visualize that data
To replicate this the easy way, download the script from Github. You will need R and RStudio installed to follow along.
For those unfamiliar, API stands for “application programming interface”. It’s a shorthand way of saying “a set of predictable web addresses with text formatted in a friendly way”. You can read through this post and get everything, but I’ve also recorded a video tutorial that may be more approachable for those less experienced with R:
1. Sign Up for an FEC API Key
You’ll get an email with a long string of characters that is your key. To protect your key, I reccomend saving it in a file that looks like the following and referencing it later, but you could just run this directly:
api_key <- "KEY_STRING_FROM_THE_UNITED_STATES_GOVERNMENT"
2. Getting Candidates into R
Robin Pollak and Jeffrey Carney put out an R wrapper for the API. Install it using the “devtools” package, load other libraries to use, and read your API key into the session:
library(devtools)
install_github("robinspollak/R.openFEC")

library(R.openFEC)
library(httr)
library(tidyverse)
source("data.gov.key")
Create a list describing the election you want to analyze. For this example, I chose to look at my home district’s upcoming house election.
election_of_interest <- list(
state = "VA",
office_abb = "H",
office_full = "house",
district = "05",
cycle = "2018",
candidate_status = c("C") #Tested options are C for current candidate, P for prior,
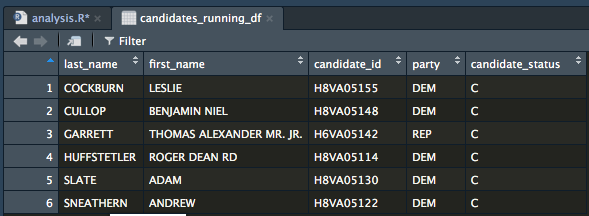
)Search for candidates running in the election you are interested in. The API returns JSON, so a little bit of wrangling is necessary to get some basic information into a dataframe of rows and columns.
candidates_running <- candidates_search(api_key,
                                        query_params = list(
                                          state = election_of_interest$state,
                                          office = election_of_interest$office,
                                          district = election_of_interest$district,
                                          cycle = election_of_interest$cycle,
                                          page="1")
)

candidates_running_df <- data.frame(
  name = map(candidates_running[["content"]][["results"]], function(x) x$name) %>% unlist(),
  candidate_id = map(candidates_running[["content"]][["results"]], function(x) x$candidate_id) %>% unlist(),
  party = map(candidates_running[["content"]][["results"]], function(x) x$party) %>% unlist(),
  candidate_status = map(candidates_running[["content"]][["results"]], function(x) x$candidate_status) %>% unlist()
) %>%
  filter(candidate_status %in% election_of_interest$candidate_status) %>%
  separate(name, c('last_name', 'first_name'), sep = ', ', extra = "drop", fill = "right") %>%
  mutate(first_name = if_else(is.na(first_name),"",first_name),
         full_name = if_else(first_name == "", last_name, paste0(first_name," ",last_name)))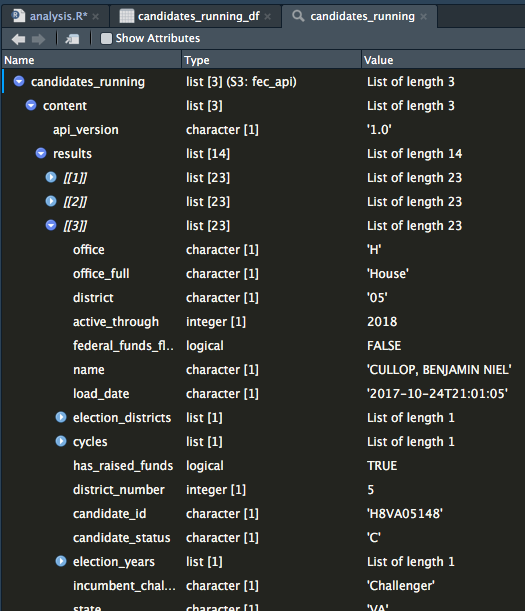
3. Getting Financial Summary Data
Knowing the candidate FEC IDs is the first step to doing cooler things with itemized receipts and disbursements eventually (not covered in this post). For now we’re using candidate status data to check whether candidates are current (there is still some nuance, as some candidates classified as current may have announced withdrawl from a race or only just entered). Getting summary financial data looks similar to the candidate search.
financial_summary <- get_election_financial_summary(api_key,
                                                    query_params = list(
                                                      state = election_of_interest$state,
                                                      office = election_of_interest$office_full,
                                                      district = election_of_interest$district,
                                                      cycle = election_of_interest$cycle)
)

financial_summary_df <- data.frame(
  name = map(financial_summary[["content"]][["results"]], function(x) x$candidate_name) %>% unlist(),
  candidate_id = map(financial_summary[["content"]][["results"]], function(x) x$candidate_id) %>% unlist(),
  total_receipts = map(financial_summary[["content"]][["results"]], function(x) x$total_receipts) %>% unlist(),
  total_disbursements = map(financial_summary[["content"]][["results"]], function(x) x$total_disbursements) %>% unlist(),
  cash_on_hand_end_period = map(financial_summary[["content"]][["results"]], function(x) x$cash_on_hand_end_period) %>% unlist()
) %>%
  left_join(candidates_running_df, by = c("candidate_id"="candidate_id")) %>%
  filter(candidate_status %in% election_of_interest$candidate_status) %>%
  select(full_name,candidate_id,party,total_receipts,cash_on_hand_end_period,total_disbursements) %>%
  gather(type,amount,total_receipts:total_disbursements) %>%
  mutate(type = str_replace_all(type,"_"," ") %>% str_to_title,
         full_name = str_to_title(full_name))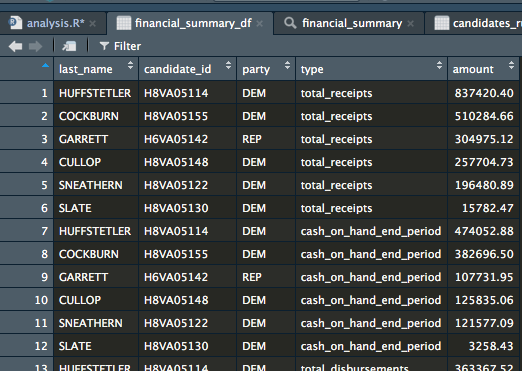
4. Visualization
The fun part and the big theme of my blog! First thing I want to do is find the end coverage date so we can properly label our chart. If there are multiple end coverage dates, this also triggers an error.
period_ending_check <- financial_summary

for(i in 1:length(period_ending_check[["content"]][["results"]])){
  if(is.null(period_ending_check[["content"]][["results"]][[i]][["coverage_end_date"]])){
    period_ending_check[["content"]][["results"]][[i]][["coverage_end_date"]] <- "None"
  }
}

period_ending <- data.frame(
  coverage_end_date = as.factor(map(period_ending_check[["content"]][["results"]], function(x) x$coverage_end_date) %>% unlist()),
  candidate_name =   map(period_ending_check[["content"]][["results"]], function(x) x$candidate_name) %>% unlist()
) %>%
  filter(coverage_end_date != "None")

if(length(levels(period_ending)) == 2){

  subtitle_string <- paste0("Differing period endings: ",substr(levels(period_ending$coverage_end_date)[1],1,10)," and ",substr(levels(period_ending$coverage_end_date)[2],1,10))

}else if(length(levels(period_ending)) > 2){

  subtitle_string <- "Many period endings, investigate more"

}else{

  subtitle_string <- paste0("Period ending ",substr(levels(period_ending$coverage_end_date)[1],1,10))

}
Order the candidates by Total Receipts, set some colors up for party affiliation, and prepare folders/filenames.
candidate_order <- financial_summary_df %>%
filter(type == "Total Receipts") %>%
arrange(amount)
financial_summary_df$full_name <- factor(financial_summary_df$full_name, levels = candidate_order$full_name)
colors <- c("DEM" = "#2c4d82", "REP" = "#8e1b1b", "IND" = "#a3a3a3", "GRE" = "#1c561d", "LIB" = "#afac3d")
output_path <- file.path("output",election_of_interest$cycle,election_of_interest$state,election_of_interest$office_full,election_of_interest$district)
dir.create(output_path,recursive = TRUE)
filename <- paste0(Sys.Date(),"-financial-summary-",election_of_interest$cycle,"-",election_of_interest$state,"-",election_of_interest$office_full,"-",election_of_interest$district,".png")
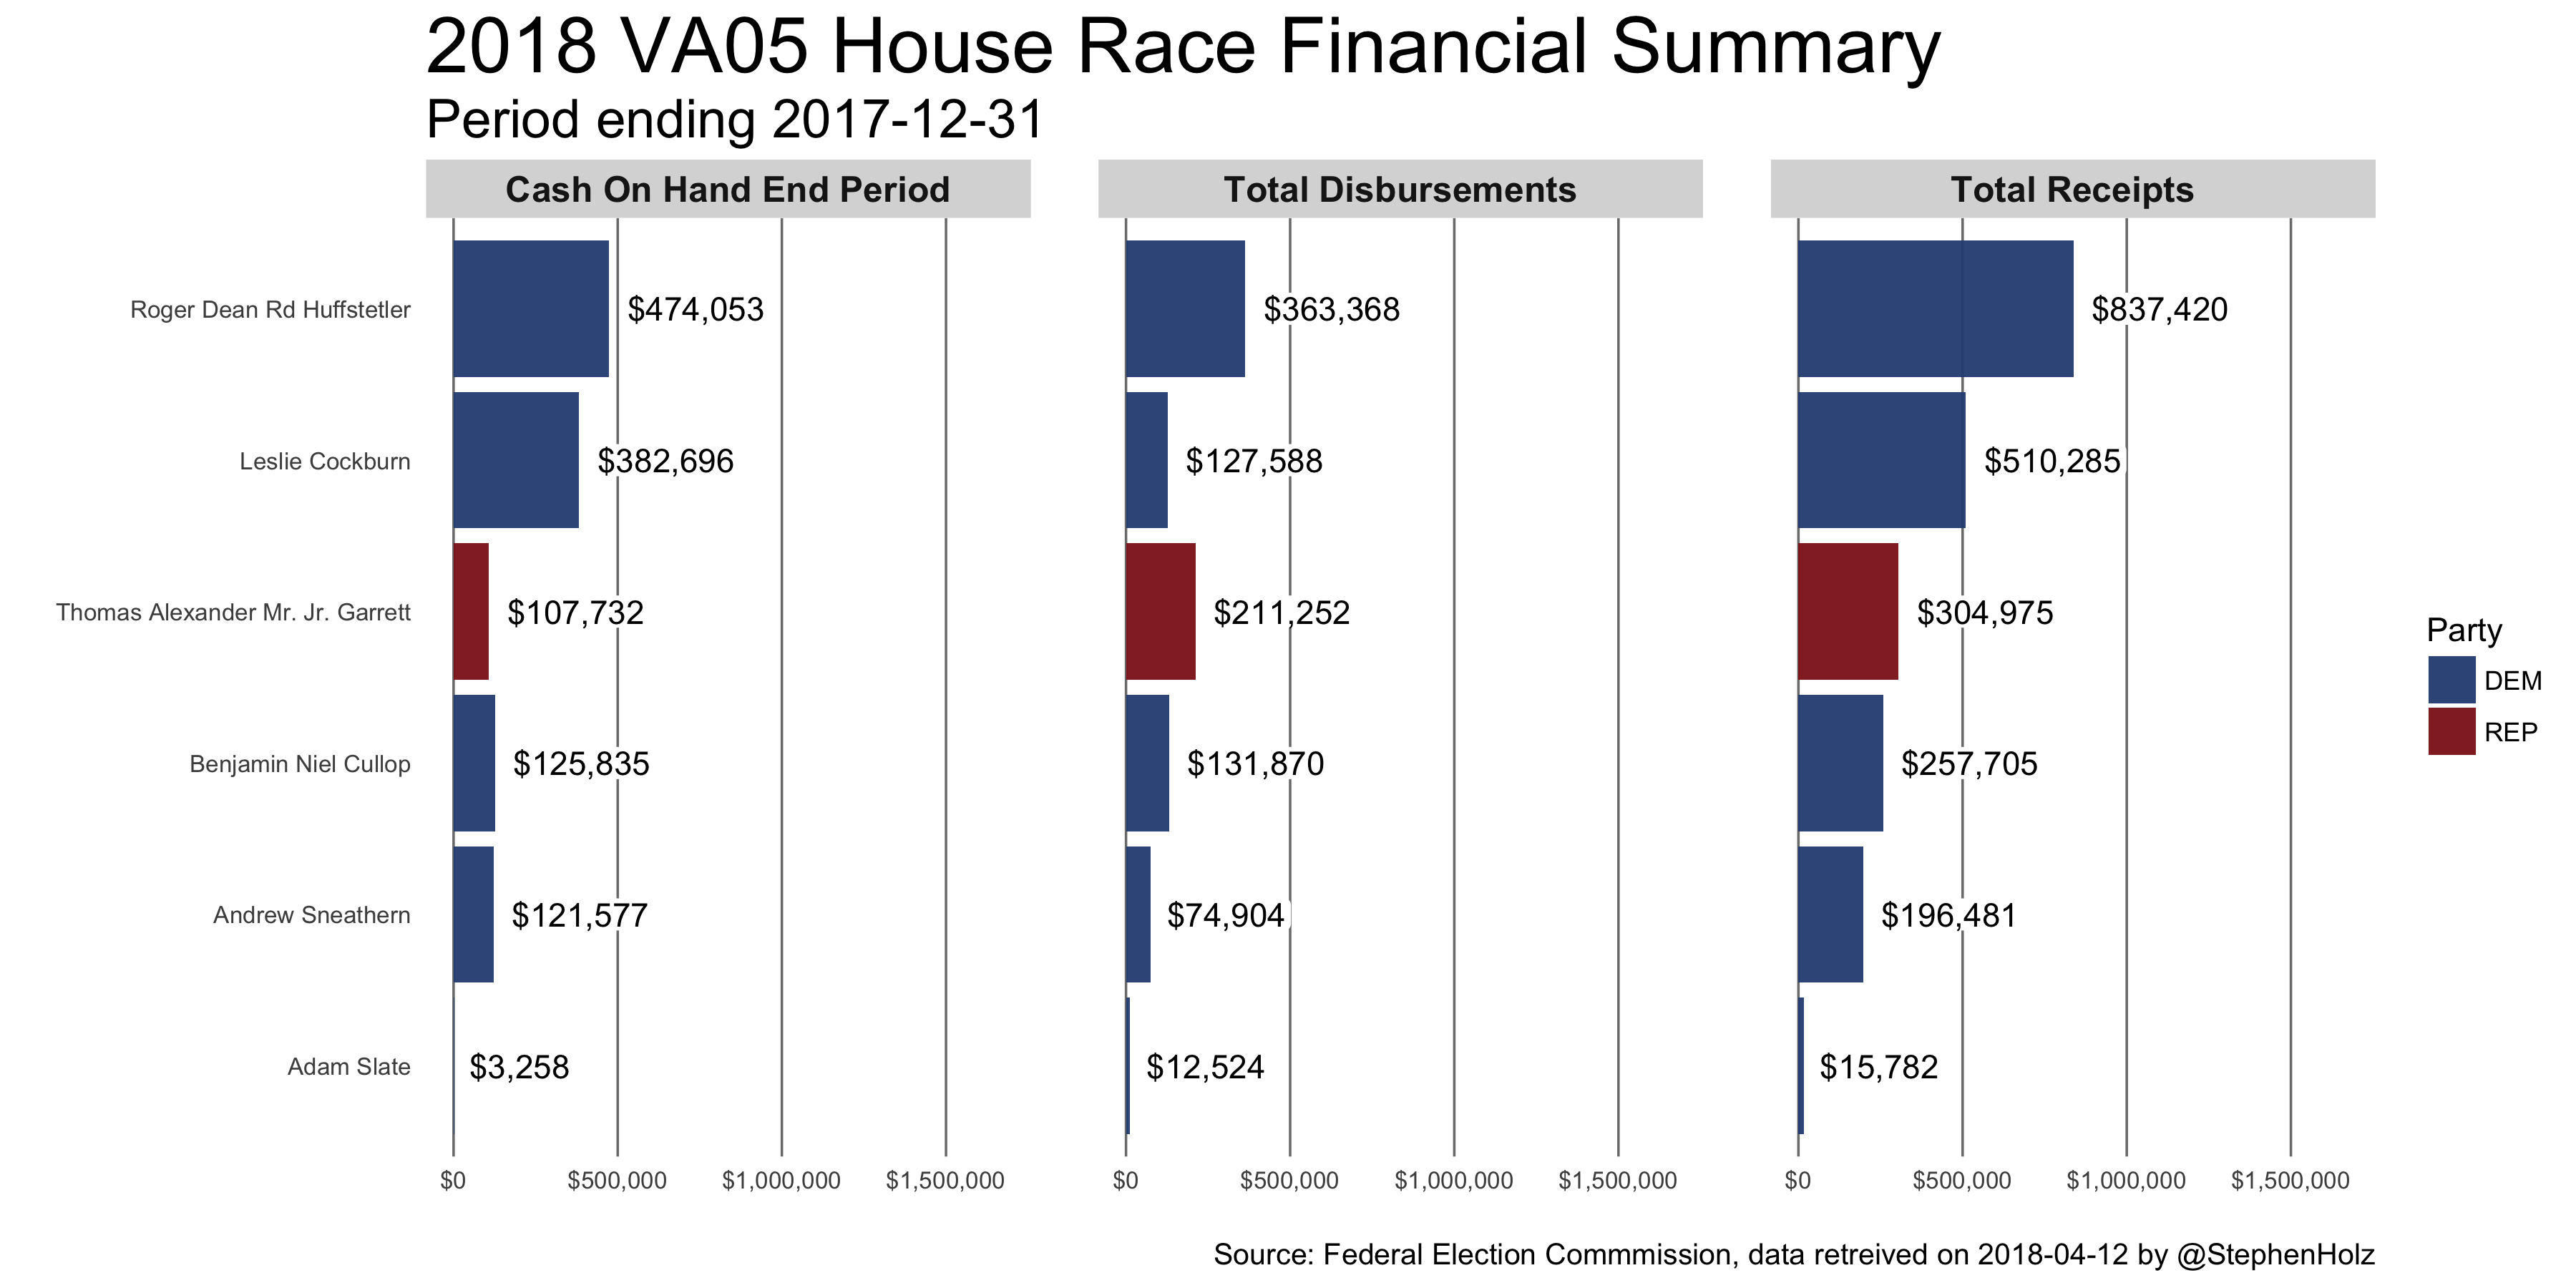
author <- "@StephenHolz"Plot the chart and save it.
p1 <- financial_summary_df %>%
  ggplot() +
  geom_bar(aes(x = full_name, y = amount, fill = party), stat = "identity", alpha = .95) +
  geom_label(aes(x = full_name, y = amount, label = scales::dollar(amount)),hjust = -0.1, label.size = 0, label.padding = unit(0.1,"line")) +
  facet_wrap(~type) +
  coord_flip() +
  scale_y_continuous(labels = scales::dollar,limits = c(if_else(min(financial_summary_df$amount) < 0, min(financial_summary_df$amount), 0),max(financial_summary_df$amount)*2)) +
  scale_fill_manual(values = colors) +
  labs(
    title = paste0(election_of_interest$cycle," ",election_of_interest$state,election_of_interest$district," ",str_to_title(election_of_interest$office_full)," Race Financial Summary"),
    subtitle = subtitle_string,
    x = "",
    y = "",
    caption = paste0("Source: Federal Election Commmission, data retreived on ",Sys.Date(), " by ",author),
    fill = "Party"
  ) +
  theme(
    panel.background = element_blank(),
    panel.grid.major.x = element_line(color = "#7c7c7c",size = .4),
    panel.grid.major.y = element_blank(),
    panel.spacing = unit(.8,"cm"),
    strip.text = element_text(size = 12, face = "bold"),
    axis.ticks = element_blank(),
    plot.title = element_text(size = 26),
    plot.subtitle = element_text(size = 18),
    axis.text = element_text(size = 8)
  )

ggsave(filename = filename, plot = p1, path = output_path, width = 12, height = 6, unit = "in")
End Result
If you do lift this, be cautious! I haven’t necessarily built in checks or corrections for all the different things the API could give back out, especially for older completed election cycles. Good luck!