Learning R in 2018
If you were wondering where to start and feeling intimidated, you are not alone! This page outlines one possible path of many to get your feet wet: by replicating some of the work published here at Charts On Charts.
1. Install a programming language called R
R is one of the top programming languages used for data analysis. It’s a free and open sourced project used by a range of folks—in everything from government to business to schools—all around the world.
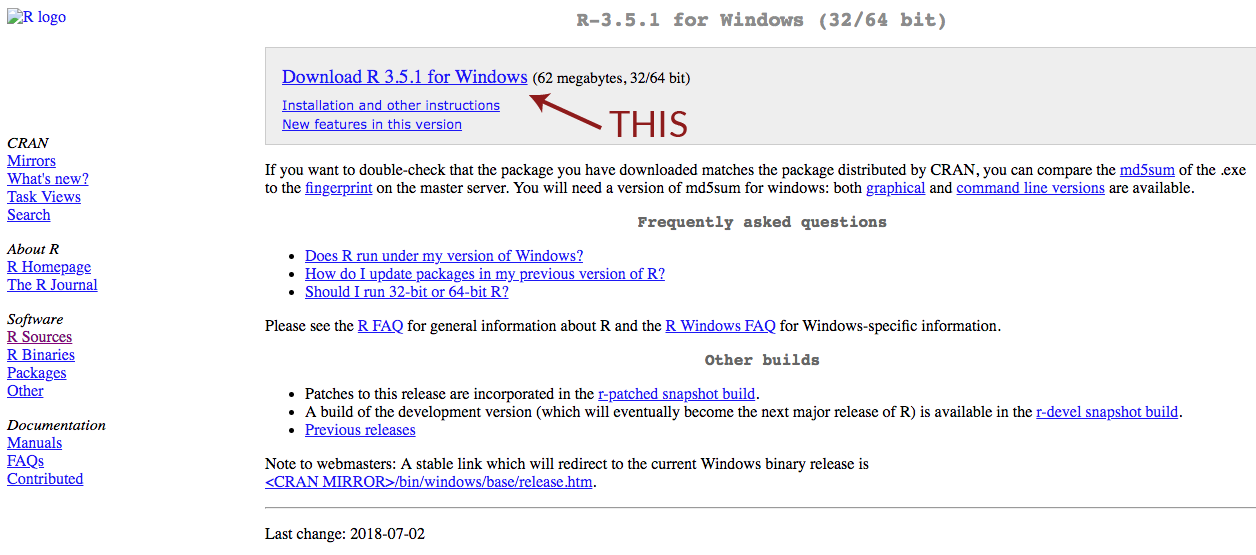
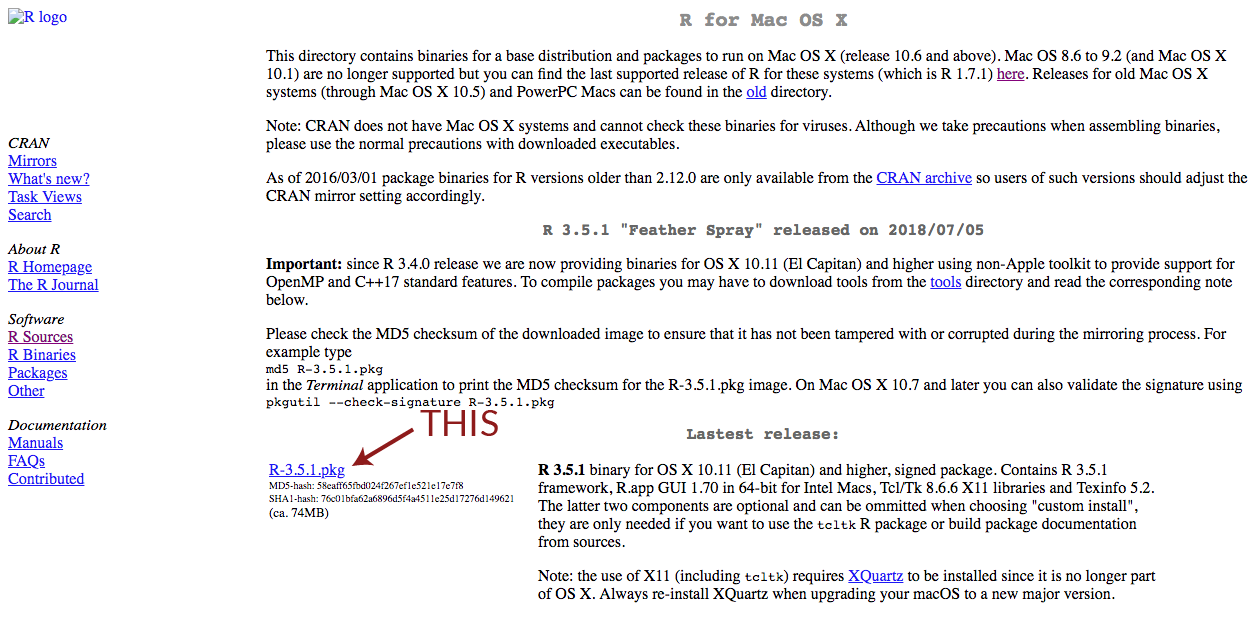
You can download and install a copy from the Comprehensive R Archive Network, choosing a server close to you.
What you want to see for Windows
What you want to see for Mac
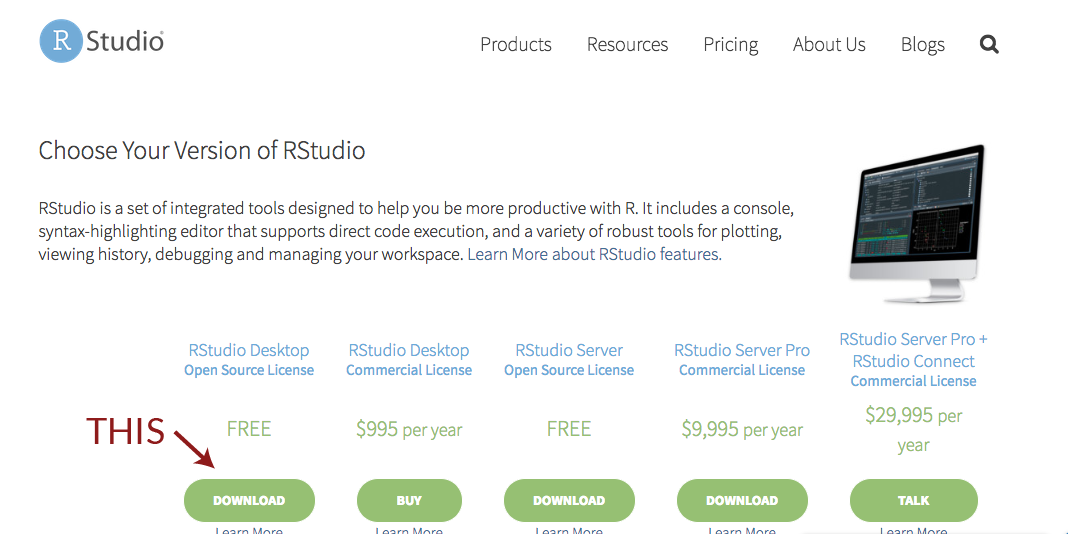
2. Install a development tool called RStudio
RStudio is a popular Interactive Development Environment for R. It’s what I use to edit R script files and work on data projects.
3. Install packages that expand the functionality of base R
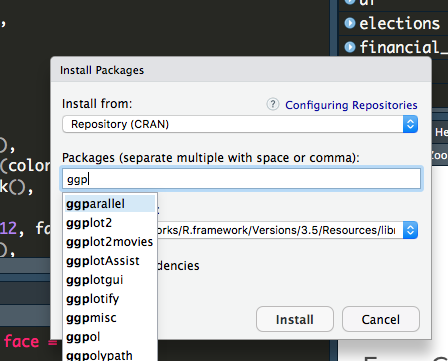
One of the most common lines of R code you will encounter is loading a package, something like library(ggplot2). Packages allow people to share code that expands the functionality of base R, but you have to make sure they are installed before loading.
In RStudio, Tools > Install Packages brings up a window where you can search for and install most packages.
You can also install packages by running R code. For some packages only available on Github, this is the way to go!
install.packages("devtools")
devtools::install_github("stephenholzman/tidyusafec")
4. Replicating work on your computer
Open RStudio on your computer and create a new R script with File > New File > R Script. It should have 4 panes, though they may have a different colorscheme.
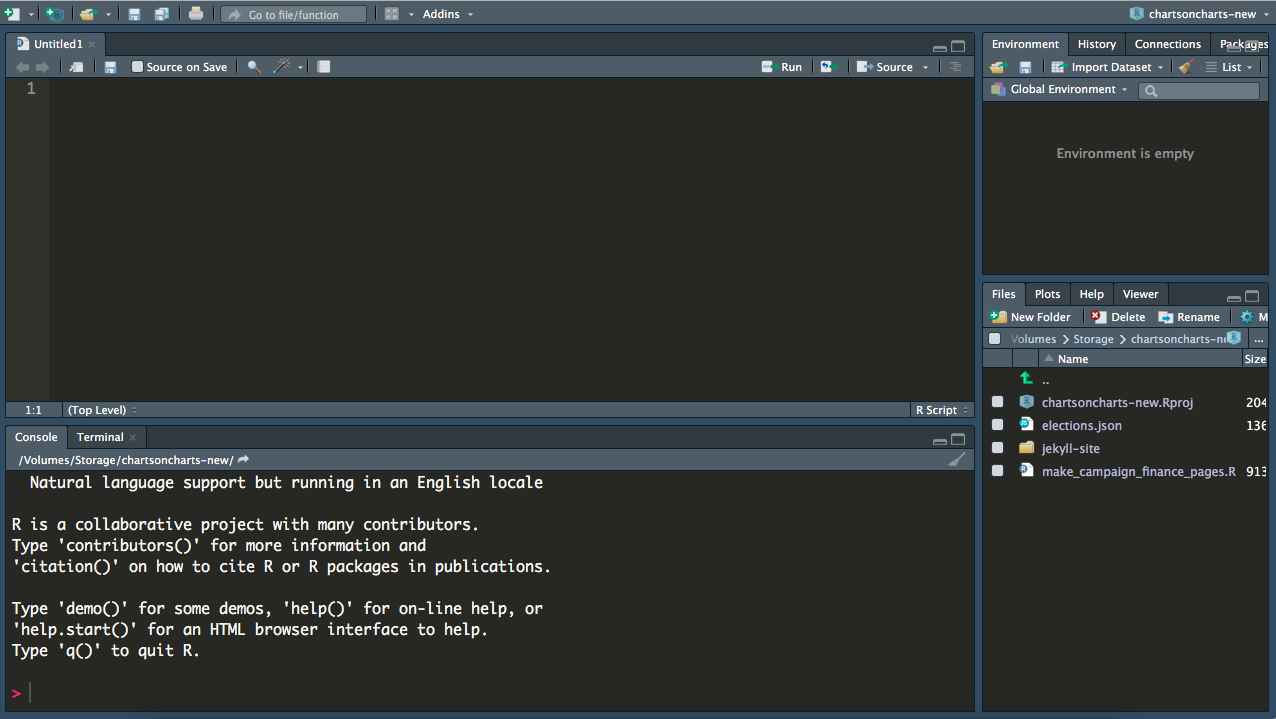
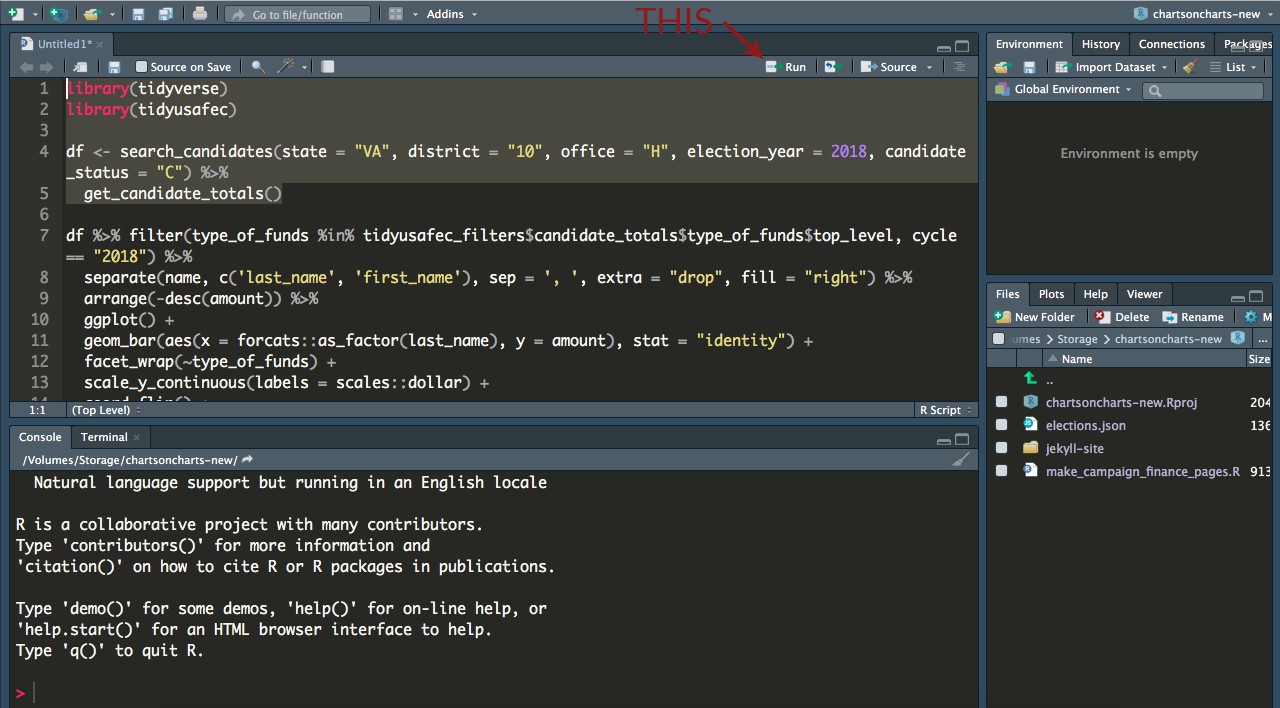
Copy code into the script. Highlight the text you want to run, and then click the run button.
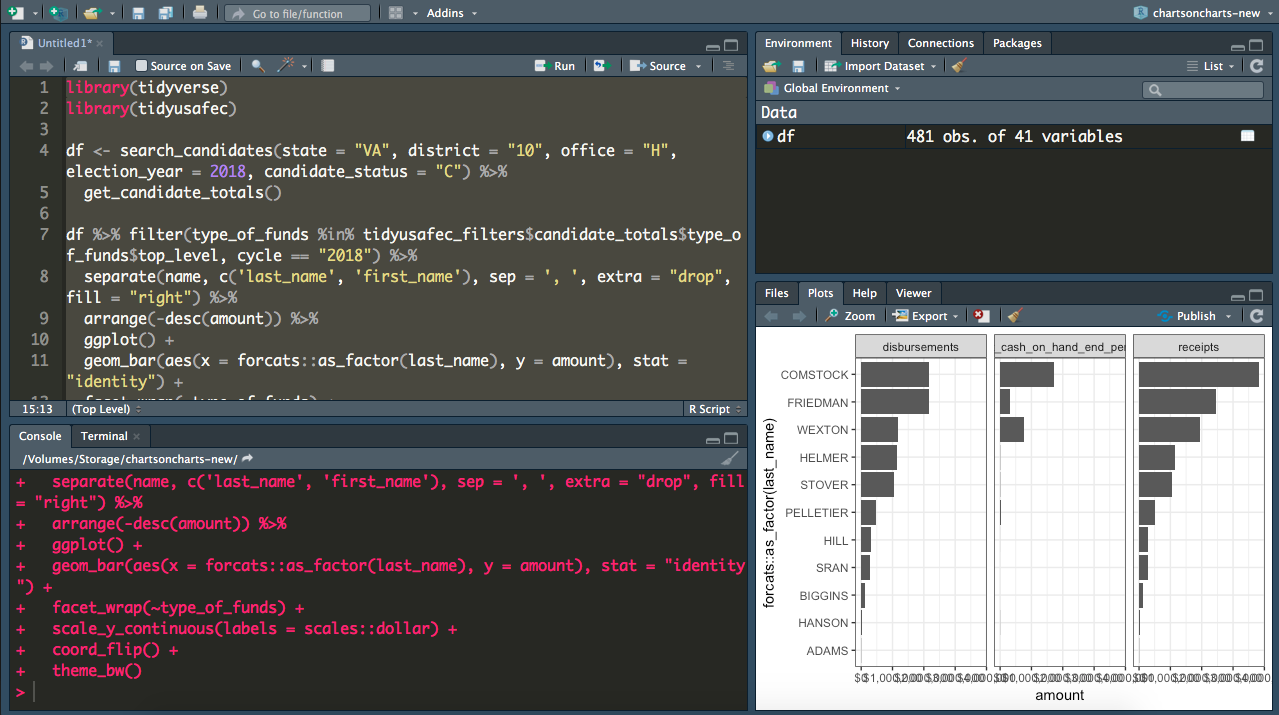
Data loaded into R by the code you run can be explored in the upper right pane’s Environment tab. Plots printed by the code are in the bottom right pane’s Plots tab. The Console tab in bottom left pane shows the R code that actually gets run. The R script in the upper left pane lets you edit code and save it for later.
5. Additional Tips and Resources
You can run code by highlighting a script or typing directly in the Console found in the bottom left RStudio pane.
When running someone else’s code, look for R comments with helpful tips.
#Comments don't do anything when run and always begin with # in R.R for Data Science by Garrett Grolemund and Hadley Wickham is a great textbook. An online version is also available for free!
R functions look like
print("Hello world!")ordate(), notable for their parentheses. You can get help for a function by typing question mark and the name, like?printor?date. Most have helpful examples.