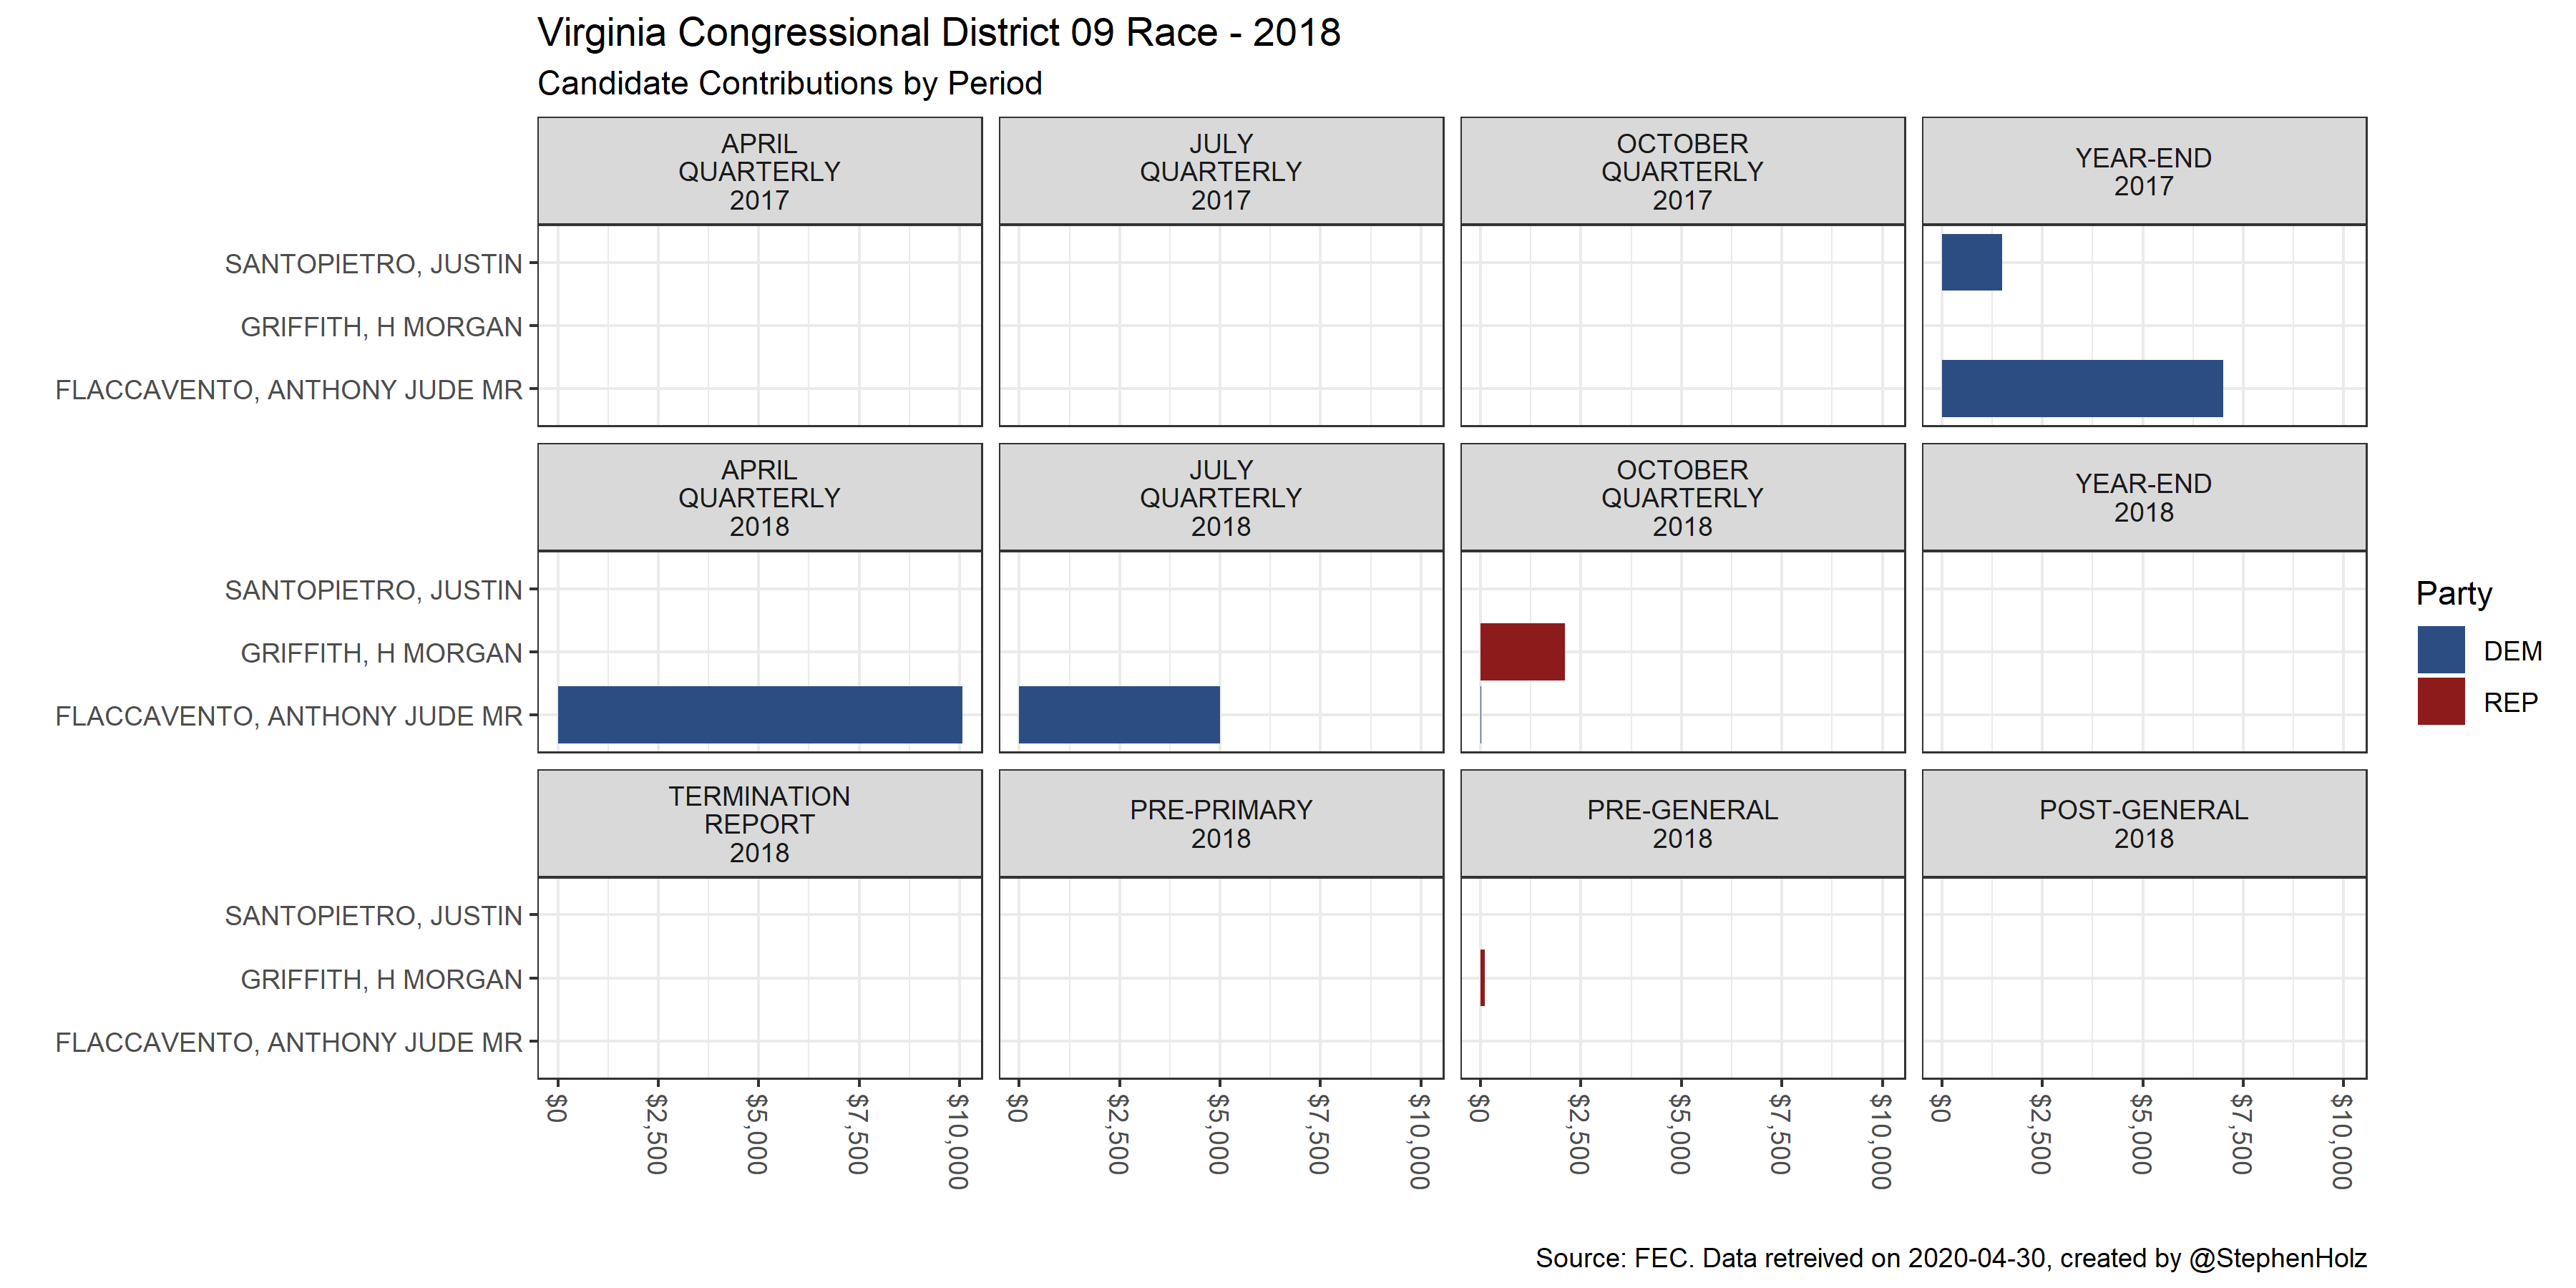
The R code below can replicate this chart. You can get help installing R here. You can get help with the tidyusafec data retreival package here.
# Load R packages

library(tidyusafec)
library(tidyverse)

# Get Data

committees <- search_candidates(
  office = 'H',
  election_year = '2018',
  district = '09',
  state = 'VA',
  unnest_committees = TRUE
)

committee_reports <- committees %>%
    get_committee_reports()

# Wrangle Data

chart_data <- committee_reports %>%
    filter(type_of_funds == 'candidate_contribution_period',
           cycle == '2018') %>%
    mutate(document_description = fct_relevel(document_description,
                                              c('APRIL QUARTERLY 2017',
                                                'JULY QUARTERLY 2017',
                                                'OCTOBER QUARTERLY 2017',
                                                'YEAR-END 2017',
                                                'TERMINATION REPORT 2017',
                                                'APRIL QUARTERLY 2018',
                                                'JULY QUARTERLY 2018',
                                                'OCTOBER QUARTERLY 2018',
                                                'YEAR-END 2018',
                                                'TERMINATION REPORT 2018',
                                                'PRE-PRIMARY 2018',
                                                'PRE-GENERAL 2018',
                                                'POST-GENERAL 2018'
                                                )
    ))

# Visualize Data

ggplot(data = chart_data) +
    geom_bar(aes(x = name, y = amount, fill = party), stat = 'identity') +
    coord_flip() +
    facet_wrap(~document_description, labeller = label_wrap_gen(width = 10)) +
    scale_fill_manual(values = c('DEM' = '#2c4d82', 'REP' = '#8e1b1b', 'IND' = '#a3a3a3', 'GRE' = '#1c561d', 'LIB' = '#afac3d','NNE' = '#0A0A0A')) +
    scale_y_continuous(labels = scales::dollar) +
    theme_bw() +
    theme(axis.text.x = element_text(angle = -90, hjust = 0, vjust = .5)) +
    labs(
      title = 'Virginia Congressional District 09 Race - 2018',
      subtitle = 'Candidate Contributions by Period',
      x = '',
      y = '',
      fill = 'Party',
      caption = paste0('Source: FEC. Data retreived on ', Sys.Date(), ', created by @StephenHolz')
    )