The Purpose of the Explore Section
The new explore section of this blog contains thousands of charts with near copy-paste ready R code to reproduce them (packages have to be installed and API keys registered). So far there are only a handful of basic chart templates for US Census and Federal Election Commission data, but the galleries are meant to be comprehensive. For example, there is a page for every state’s population estimates by age as reported by Census. I think of it kind of as a proof-of-concept for how data publisher galleries might look in a technically literate society. We shouldn’t just provide a table or chart; provide examples of the kind of language that helps you work with these representations.
Managing many different types of files is one of the biggest barriers I’ve seen for someone just starting. The copy-paste functionality gets a satisfying result quickly. Differences between examples are a natural introduction to functions and arguments. The concentrated examples include 4 necessary parts of analysis.
- Choose your tools.
- Get your data.
- Arrange your data into a useful shape.
- Visualize data to better understand it.
Example Page Content - Virginia’s Population
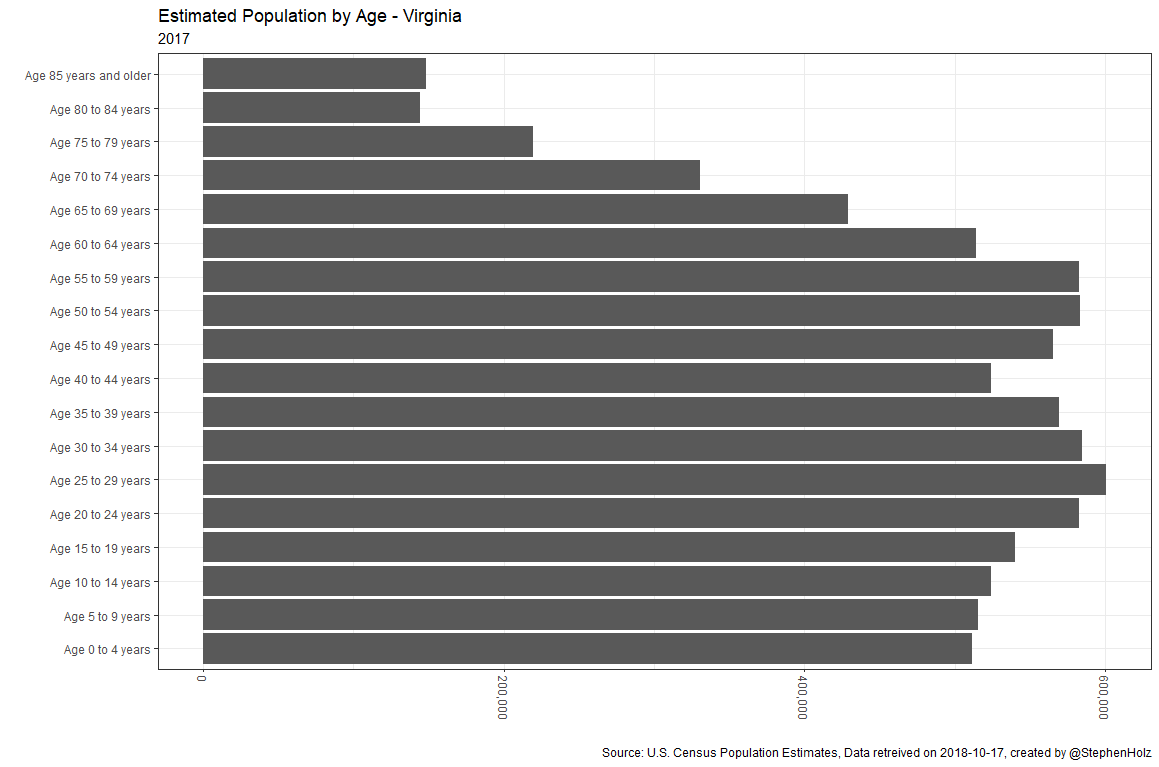
The R code below can replicate this chart. You can get help installing R here.
You can get help with the tidycensus data retreival package here.
# Load R packages

library(tidycensus)
library(tidyverse)

# Get Data

population <- get_estimates(geography = 'state',
                            product = 'characteristics',
                            breakdown = c('SEX', 'AGEGROUP', 'HISP', 'RACE'),
                            state = 'VA',
                            breakdown_labels = TRUE,
                            time_series = TRUE)

# Wrangle Data

chart_data <- population %>%
    filter(
      SEX == 'Both sexes',
      str_detect(AGEGROUP, '^Age'),
      HISP == 'Both Hispanic Origins',
      RACE == 'All races',
      DATE == 10
    )

# Visualize Data

ggplot(data = chart_data) +
    geom_bar(aes(x = AGEGROUP, y = value), stat = 'identity') +
    coord_flip() +
    scale_y_continuous(labels = scales::comma) +
    theme_bw() +
    theme(axis.text.x = element_text(angle = -90, hjust = 0, vjust = .5)) +
    labs(
      title = 'Estimated Population by Age - Virginia',
      subtitle = 2017,
      y = '',
      x = '',
      caption = paste0('Source: U.S. Census Population Estimates, Data retreived on ', Sys.Date(), ', created by @StephenHolz')
    )
The Purpose
Most importantly, I want to plant seeds that anyone can use programming languages and it’s never been easier to get something useful quickly.
I personally plan to use this as a quick visual reference for a variety of topics. This began as an effort to organize my local files into something with more utility and got out of hand applying it to some loftier goals explained below.
Though I might be able to recreate these charts from scratch in a few minutes, why not do it in a few seconds and move on to higher level problems? Even better that others can view complete sets of things I’m working on for their benefit. Those not immediately interested in the code included.
Why I Think This is Important
Like many, I got into R to work on fancy models. The task I was interested in was building stochastic population forecasts. A much harder task is building a world that appreciates and understands stochastic population forecasts.
But that is a task I’m now interested in.
This is something I’ve been thinking about for a while. Since that comment I’ve had a chance to work on an actual education policy project while working for the University of Virginia and I’ve been volunteering with the Computers4Kids organization in Charlottesville coming up on two years (Note from 2020: I’m now an educational policy analyst at the Florida Department of Education). My understanding of the challenges to overcome and the goals to set toward building a numerate world has improved dramatically.
The tools need to be less intimidating. The examples need to be plentiful. The examples need to be relevant real things.
I teach global health, and I know having the data is not enough. I have to show it in ways people both enjoy and understand.
Hans Rosling
Because I apparently can’t write a blog post without quoting him, I would say my philosophy has evolved to an extension of this.
We know that having the data isn’t enough. We have to show it in ways people can enjoy, understand, replicate effortlessly if they wish, and ultimately internalize at a level deep enough to guide our actions.
We can’t jump straight into expecting a high schooler to replicate a stochastic population forecast (even though one talented C4K member I worked with attempted just that). These code examples provide a starting point that is both useful and approachable. This will be one of the first resources I point new learners to.
I’ve also been excited to see RStudio assembling an education team. It’s quite stacked and I’ll be following that closely.
Work in Progress
These charts are still sub-optimal technically speaking. Just above, the font sizes are off and I hate vertical text. Putting out simple code was a higher immediate goal. The page navigation is also primitive. I’ll refine these as the process matures.
This took a major blog rebuilding effort. My old blog used Jekyll and took far too much time to build on the first iteration. I also explored Django for a few days, but I try to limit the amount of Python I have to use and didn’t want to run a server. Hugo was great and most importantly fast. I didn’t want to build the whole site all the time so I pieced together a few scripts that use Hugo as an engine. This gives me more control over what I convert to HTML and when.
There are R scripts to make individual pages, charts, and navigation pages that are slowly moving into custom packages. Ideally and with time, I think making it easier for others to build similar static site galleries is possible.